New Study Published on Softball Pitch Volume and Reported Pain/Injury

If you’ve been reading our content for the last year, you’ll know we’ve been focused on digging into the latest published research on softball pitchers related to pain, injury, and recovery.
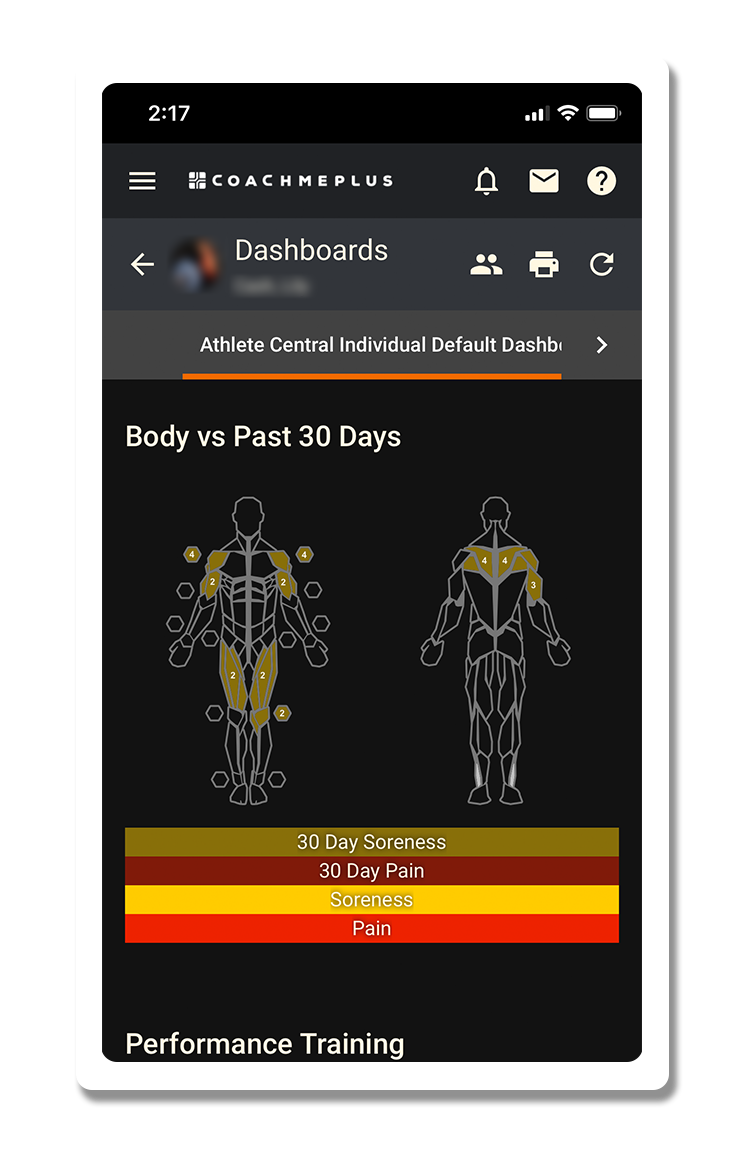
(Read: How we track softball pitcher recovery)
Why are we focusing on this? We want to make sure that we’re doing everything we can to keep softball pitchers as healthy as possible to play, and we want to advocate for them. Softball pitchers do not have as much data available to them (kinesiology-related, performance, or otherwise) compared to their baseball peers.
Researchers have started to identify this as a gap as well. An interesting study was recently published in the September-October 2022 Issue of Sports Health.
Let’s chat through the study and the findings.


Relationship Between Pitch Volume and Subjective Report of Injury in High School Female Fast-Pitch Softball Players (Sep-Oct 2022)
Authors: Brittany Gooch, DPT, Bradley S. Lambert, PhD, Haley Goble, MHA, Patrick C. McCulloch, MD, and Corbin Hedt, DPT
Read it for yourself: PubMed | PDF
Summary:
28 softball pitchers between the ages of 14-18 participated in an online survey of questions that encompassed pitching volume, history, and included a subjective report of pain or injury. The study focused on pain/injury to the back, shoulder, and/or elbow. The authors then examined the comparisons between pitch volume and those athletes that reported pain and those that did not.
Results:
Higher cumulative pitching volume resulted in more self-reported pain in either one or multiple regions of the body— with different percentage correlations depending on total pitch count per week, games pitched per day, or games pitched per week.
Study Limitations:
Small sample size
Recall accuracy - respondents might not have been able to accurately recall the exact pitch volume
Asked about how often athletes practiced pitching, but not how many full effort pitches were included in training outside of game scenarios

Key Insights:
“Those who pitched more than 85 pitches per game were more likely to spend an increased percentage (49.3% vs 25.2%, respectively) of the season ‘playing through pain’ (P < 0.05). (p. 704)
“The majority of pitchers indicated that they had been pitching with pain for greater than one-third of the year.” (p. 704)
“Injured pitchers pitched nearly double the pitches per season compared with their uninjured counterparts.” (p. 707)
Single-game pitch counts were not necessarily representative of self-reported pain or injury, but they were higher in those who sought medical attention and in those who reported playing through pain.”
Our Thoughts
The results are not surprising, given what we’re seeing anecdotally with our own athletes. We’re tracking our pitching athletes’ pitch counts, and we’re also tracking regional pain (but the whole body, not just shoulders, elbows, and back).
Clearly, the softball windmill pitch is not a natural motion.
A story of cumulative effect
I think the really important thing to try and understand here is the cumulative effect of these pitches. Some athletes pitched…
multiple games in a single day
multiple games in a weekend
OR pitched a lot in a single game.
Lack of recovery and rest in between pitching bouts MUST play an important part in these athlete’s reports of playing through pain.
I’m also interested in what would have changed in this study if athletes had submitted full effort pitch counts from practice… and not just from games.
A magic pitch count metric? Data seems to be lining up with baseball norms.
Cumulative pitch count volume is clearly important and significant. In the study, athletes who were pitching approximately between 300-500 pitches per week had higher reported pain or injury in the shoulder and back.
Those that did not report pain in the shoulder or back were pitching roughly 150-250 pitches per week. This lines up with accepted baseball pitch counts for this age range (more on that here).
When we start analyzing our data, we’ll be looking to see if these ranges play out as important in our athlete population. One pitch count number isn’t a magic bullet, however, so we’re working with our software partners at CoachMePlus to produce some charts and dashboards to help us better understand our athletes’ individual tolerances to pitching volume and recovery.

It’s time for a pitch count
Proven joint distraction forces and emerging pain and injury data are starting to back up the same wear-and-tear issues and pitch count standards that we’ve adopted in baseball.
A softball standard for pitch counts and recovery intervals would go a long way to better protecting our athletes. We don’t want to see high-level athletes over-utilized and injured and unable to play… or negatively impact their long-term health.
Interested in learning more about why we’re advocating for a pitch count? Knock yourself out.
References:
Gooch, B., Lambert, B. S., Goble, H., McCulloch, P. C., & Hedt, C. (2022). Relationship Between Pitch Volume and Subjective Report of Injury in High School Female Fast-Pitch Softball Pitchers. Sports health, 14(5), 702–709. https://doi.org/10.1177/19417381211051381