Tips from a Baseball Physical Therapist (Part 2): Assessing and Minimizing Injury Risk
Author: Taylor Miller, PT, DPT, SCS, CSCS

For those of you who are tuning back in for Part 2, thank you! I hope that you were able to glean at least one or two valuable pieces of information from Part 1 of this blog.
It’s not the most fun and exciting content, but in my opinion, understanding the intricacies of workload management and why we are continuing to see a rise in throwing-related injuries is vital to combating the problem as a whole.
With that being said, bear with me for this next section, where we will take a deeper dive into the objective side of a thrower’s assessment and how we use this data to:
Quantify injury risk
Understand how a thrower responds to repetitive stress over the course of the competitive season
Work to minimize the risk for developing an injury in the first place
The Thrower’s Assessment
Mobility

When it comes to mobility, more often than not, throwers can be classified into one of two groups: HYPERmobile or HYPOmobile. Whether you move too much or not enough, one must consider that “mobility” within the throwing population is unique. Unique in the fact that the overhead throwing motion is NOT a natural, healthy, or ideal position for the upper extremity to be in.
When it comes down to it, throwing is not “good” for you, especially at higher intensities and volumes.
For this section, I will be diving further into the shoulder itself regarding the necessary mobility for a thrower. However, it is no secret that the throwing motion is a product of total body mobility, coordination/motor control and movement efficiency. Utilization of the entire kinetic chain is vital when it comes to effectively and efficiently dissipating force from the ground up through ball release.
I am a firm believer that deficiencies from a mobility perspective elsewhere within the kinetic chain can place excess stress on other segments (i.e. lack of appropriate hip rotational mobility can cause excess stress up the chain, a common deficiency found in those diagnosed with oblique injuries). Like I mentioned earlier, throwers are unique.
From a medical perspective, we commonly see anatomical changes within the shoulder via imaging that are:
Adaptive changes in response to the stresses placed upon the body during the throwing motion
Protective or pathological changes based on the context/situation
Simply put, there are four primary motions of the shoulder that we assess in order to quantify injury risk/determine how “healthy” a thrower’s shoulder proves to be at any given point in time:
Shoulder Flexion
Horizontal Adduction (crossbody)
External Rotation
Internal Rotation
Shoulder Flexion
Mike Reinold, an expert physical therapist and researcher within the baseball rehab realm describes a thrower’s shoulder flexion as the “barometer” for shoulder health. If your lat and mini lat (teres major) do not allow good, clean overhead motion, a wide range of issues or compensatory strategies can result up or down the chain. Depending on the research study you look at, a thrower’s overhead mobility/shoulder flexion typically sits in the ballpark of 160-175 degrees.
However, more importantly, the overall difference between the throwing and non-throwing side should be 5 degrees or less. When this measurement gets outside of that 5 degree window, an increased risk for injury results. More specifically, a shoulder flexion deficit of 5+ degrees within the throwing shoulder had a 2.8 times greater risk for injury about the throwing-side elbow.

Flexion
Horizontal Adduction
Similar to shoulder flexion, horizontal adduction is also a shoulder mobility measure that should be within 5 degrees when comparing side to side (this will be a common theme involving most shoulder mobility measurements in some way shape or form). From an overall measurement standpoint, a thrower’s dominant side crossbody motion should be right around 40 degrees.
However, in my experience, I have found it fairly rare to have someone measure at 40+ degrees on their throwing side. Given the amount of eccentric stress absorbed by the rotator cuff (and potential changes within the posterior capsule- depending who you ask), it is not uncommon to develop some pretty nasty, beat up tissue within the backside of the throwing shoulder… leading to limited mobility within this motion.

Horizontal Adduction
Internal & External Rotation
Lastly, and probably the most important piece of the shoulder mobility puzzle: rotational motion. First things first, when looking at internal and external rotation of a thrower’s shoulder, one must consider a few things:
Measurement technique is key.
The numbers gleaned from 2 different studies looking at the same piece of information (in this case shoulder rotational motion) are not built the same. Unfortunately, how one physical therapist measures shoulder internal rotation can be completely different than how another therapist measures it. Going back to my previous point, there must be sufficient intra-rater reliability in order to trust your data (i.e. be consistent with how you measure/stabilize).GIRD (Glenohumeral Internal Rotation Deficit) is not as bad as people make it out to be, in my opinion.
GIRD is a fancy term used to basically say that there is a lack of internal rotation on a thrower’s dominant side. The good news is… this is normal. The science on how/why this is normal and actually beneficial for a thrower’s shoulder is fascinating from an anatomical perspective, but I won’t bore you with that right now (reach out if you want to hear more, I love talking about this stuff! 🤓).Assessing rotational motion can get tricky.
But… it can tell you a lot when it comes to quantifying one’s risk for injury. The literature is fairly clear that if a thrower’s total arc of motion (TROM) is more than 5 degrees off side to side, it correlates to an increased risk for injury. TROM can be measured by simply adding up the external + internal rotation measurements on each side.
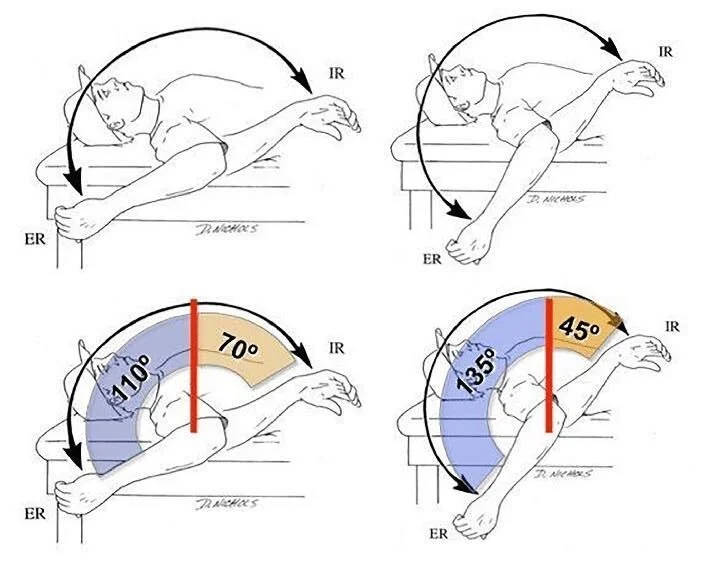
The graphic shows the differences of the throwing and non-throwing side TROM. From what I’ve seen, a thrower’s TROM usually ends up somewhere between 160-190 degrees. Now, have I seen numbers outside of that range? Absolutely, all the time...and this is usually one reason why they are in rehab to begin with. How a thrower’s rotational motion measures can depend on many different factors: throwing history, positions played, anatomy, time of the year, righty vs lefty, etc. All in all, as a thrower, getting your range of motion assessed multiple times per year can not only raise any red flags regarding injury risk, but also point you in the direction of where your time should be spent from a mobility/strength perspective.
Not everyone needs more mobility, however, rotational athletes must ensure that their mobility is sufficient for the demands of their sport/position.
The last thing to point out regarding shoulder mobility: I guarantee that there are throwers of all ages and skill levels out there that have mobility numbers classifying them as an “increased risk for injury”, yet they are perfectly fine. I don’t believe that saying “it’s not if, but when” regarding a future injury is fair, because some athletes are great compensators, smart about their workloads, have great coaches, listen to their bodies, are efficient with their mechanics… I could go on and on.
But I definitely am a firm believer that if a thrower demonstrates certain mobility deficits, it certainly heightens their risk for injury when care is not taken to offset this risk. The first step is knowing that you are at risk!

Internal Rotation

External Rotation
Wrapping up Mobility
I recently came across a tweet from a renowned strength coach within the baseball world, Eric Cressey. When describing mobility and injury risk, Eric mentions…
“Mobility is usually defined as the ability to get INTO desired positions/postures. What this definition doesn’t convey well is that ideal mobility is just as important for getting one OUT OF desirable positions/postures- and that’s often when injuries occur.”
I love this quote as I feel like it describes what we see and try to balance as clinicians within the baseball realm on a daily basis. You can have pristine, perfect mobility head to toe, but if you lack the ability to control movement throughout this range, as well as lack the ability to get out of certain end-ranges of motion, this is where injuries occur. See below for a summary of what I look for mobility-wise within a thrower’s shoulder (please note that every athlete is different and that their “normal” may not exactly line up with the numbers listed below).
| Mobility | Injury Risk Cutoff |
| Shoulder Flexion | <5 degrees difference side to side + at least 160 degrees on throwing side |
| Shoulder ER at 90 | at least 5 degress more than non-throwing side |
| Shoulder IR at 90 | no less than 20 degress on throwing side |
| Total Arc of Motion (ER + IR) | <5 degress difference side to side + ideally near 180 degrees on throwing side |
| Shoulder Horizontal Adduction | <5 degress difference side to side + ideally near 40 degrees on throwing side |
Strength
Arguably just as important as mobility, strength is yet another piece of the injury risk mitigation puzzle. From the clinician’s viewpoint, I am certainly biased, however I strongly believe most would agree with me in that we MUST be objective when measuring strength in throwing athletes (really all athletes for that matter).
A manual muscle test will not cut it. At the very least, having a cheap crane scale rigged up, or better yet, access to a hand held dynamometer is a must when assessing the strength of a thrower.

However, this is easier said than done. Using a hand-held dynamometer takes practice to accurately and confidently utilize and therefore, be able to trust the data you’re collecting.
For those curious clinicians out there interested in how to properly and accurately utilize a hand-held dynamometer, this resource from Mike Reinold, Sports PT/baseball rehab guru, is a must read!
The research regarding strength within the throwing population is interesting, although it makes sense. Timing matters. A thrower’s strength in the spring vs the summer vs the fall is likely to change…and not for the better.
Going back to our workload discussion in Part 1 of this blog, as workload increases, other metrics pay the price- one of those being strength. The weaker one becomes, the more prone to fatigue they will be. And without question, the #1 risk for injury (up to a 36-fold increased risk) is throwing while fatigued.
I will always have a hard time understanding why some players, parents and/or coaches are okay with kids pitching on consecutive days, going in to play catcher right after pitching and/or do not track pitch counts- the same kids with open growth plates, poor movement patterns, and who eat junk/sleep like crap. It’s no wonder we are seeing a rise in throwing-related injuries!
Coming off my soap box, below you will find the positions that I commonly assess in throwers with a dynamometer, as well as the specific cutoffs of each that demonstrate sufficient strength according to the literature:
| Strength | Injury Risk Cutoff |
| Shoulder Scaption | at least 95% LSI + at least 15% of body weight |
| Shoulder ER at 0 | at least 95% LSI |
| Shoulder IR at 0 | at least 95% LSI |
| Shoulder ER at 90 | at least 95% LSI |
| ER:IR Ratio | within 67-75% range |
| Grip | at least 95% LSI |
Final Thoughts
I could go on and on about numbers and metrics and which studies say what about injury risk, but when it comes down to it, all of that is meaningless without the support and buy-in of parents and coaches. Yes, athletes must advocate for themselves when able, however the problem is that most do not know any better. Throwing while fatigued and collectively throwing more than 8 months out of the year are two of the most predictive findings correlating to an increased throwing-related injury risk. Youth, adolescent and teenage baseball players (who not to mention also have open growth plates) are not meant to be throwing year-round, especially at high intensities and volumes.

Although baseball specific, I have used this pyramid graphic from renowned strength and conditioning coach, lecturer and Director of Player Health for the New York Yankees, Eric Cressey, more times than I can count. Too often I see athletes laser-focused on their Trackman or HitTrax data, rather than the foundational components of this performance-based hierarchy: developing appropriate strength, stability, mobility and power… in ALL planes of motion.
If you can’t squat your bodyweight, you shouldn’t be focused on your spin rate. If you can’t properly demonstrate a loaded hip hinge, stop looking at your exit velocity. If you aren’t disciplined enough to get at least 8 hours of quality sleep, eat right and prioritize recovery, what makes you think you will last from March to October playing the same sport requiring highly stressful, repetitive, unnatural movements (i.e. overhand throwing) without developing some sort of injury?
Focus on the little things… and by “little,” I mean the things most athletes forget about which actually have the most impact on decreasing their injury risk: moving well, being strong, sleep/diet, and recovery.
References:
Gabbett TJ, Whyte DG, Hartwig TB, Wescombe H, Naughton GA. The relationship between workloads, physical performance, injury and illness in adolescent male football players. Sports Med. 2014 Jul;44(7):989-1003. doi: 10.1007/s40279-014-0179-5. PMID: 24715614.
Wilk KE, Macrina LC, Arrigo C. Passive range of motion characteristics in the overhead baseball pitcher and their implications for rehabilitation. Clin Orthop Relat Res. 2012 Jun;470(6):1586-94. doi: 10.1007/s11999-012-2265-z. PMID: 22532313; PMCID: PMC3348299.
Wilk, K. E., Arrigo, C. A., Hooks, T. R., & Andrews, J. R. (2016). Rehabilitation of the overhead throwing athlete: there is more to it than just external rotation/internal rotation strengthening. Pm&r, 8(3), S78-S90.
Reinold, M. M., & Gill, T. J. (2010). Current concepts in the evaluation and treatment of the shoulder in overhead-throwing athletes, part 1: physical characteristics and clinical examination. Sports Health, 2(1), 39-50.
Bullock, G. S., Faherty, M. S., Ledbetter, L., Thigpen, C. A., & Sell, T. C. (2018). Shoulder range of motion and baseball arm injuries: a systematic review and meta-analysis. Journal of Athletic Training, 53(12), 1190-1199.
Reinold, M. M., Gill, T. J., Wilk, K. E., & Andrews, J. R. (2010). Current concepts in the evaluation and treatment of the shoulder in overhead throwing athletes, part 2: injury prevention and treatment. Sports Health, 2(2), 101-115.
Wilk, K. E., Macrina, L. C., Fleisig, G. S., Aune, K. T., Porterfield, R. A., Harker, P., ... & Andrews, J. R. (2014). Deficits in glenohumeral passive range of motion increase risk of elbow injury in professional baseball pitchers: a prospective study. The American journal of sports medicine, 42(9), 2075-2081.
Wilk, K. E., Macrina, L. C., Fleisig, G. S., Aune, K. T., Porterfield, R. A., Harker, P., ... & Andrews, J. R. (2015). Deficits in glenohumeral passive range of motion increase risk of shoulder injury in professional baseball pitchers: a prospective study. The American journal of sports medicine, 43(10), 2379-2385.